One company I freelance for, have installed ElasticSearch, and they ‘harvest’ Windows clients information. I want this at home as well.
In this post I’ll blog about the installation steps taken.
Installation on unraid environment
The ElasticSearch documentation has a section for docker. https://www.elastic.co/guide/en/elasticsearch/reference/8.17/docker.html
But its docker commands, and I want some docker compose file.
ChatGPT to the rescue:
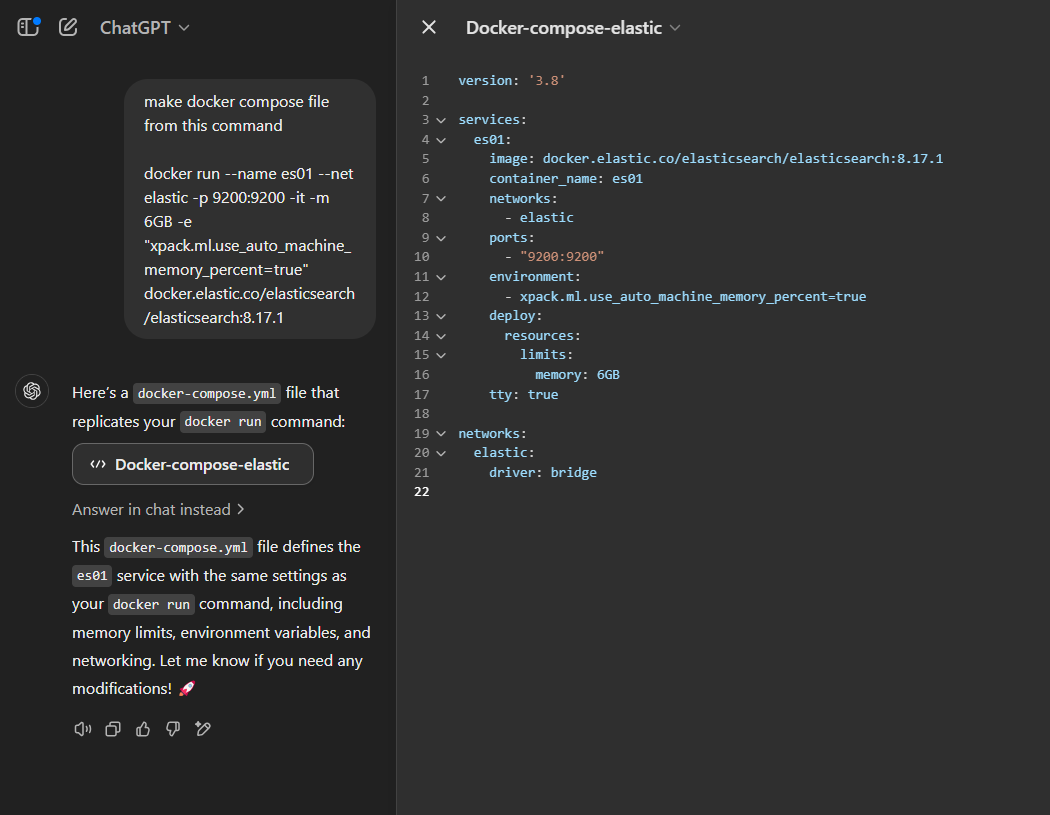
I’ve added some volumes information, and here is my final version
version: '3.8'

volumes:
  elasticsearchdata01:
  kibanadata:

services:
  elasticsearch01:
    image: docker.elastic.co/elasticsearch/elasticsearch:8.17.1
    container_name: elasticsearch01
    networks:
      - elastic
    volumes:
      - elasticsearchdata01:/usr/share/elasticsearch/data
    ports:
      - "9200:9200"
    environment:
      - xpack.ml.use_auto_machine_memory_percent=true
    deploy:
      resources:
        limits:
          memory: 6GB
    tty: true

networks:
  elastic:
    driver: bridge
Lets check the logs what happened. The horror….
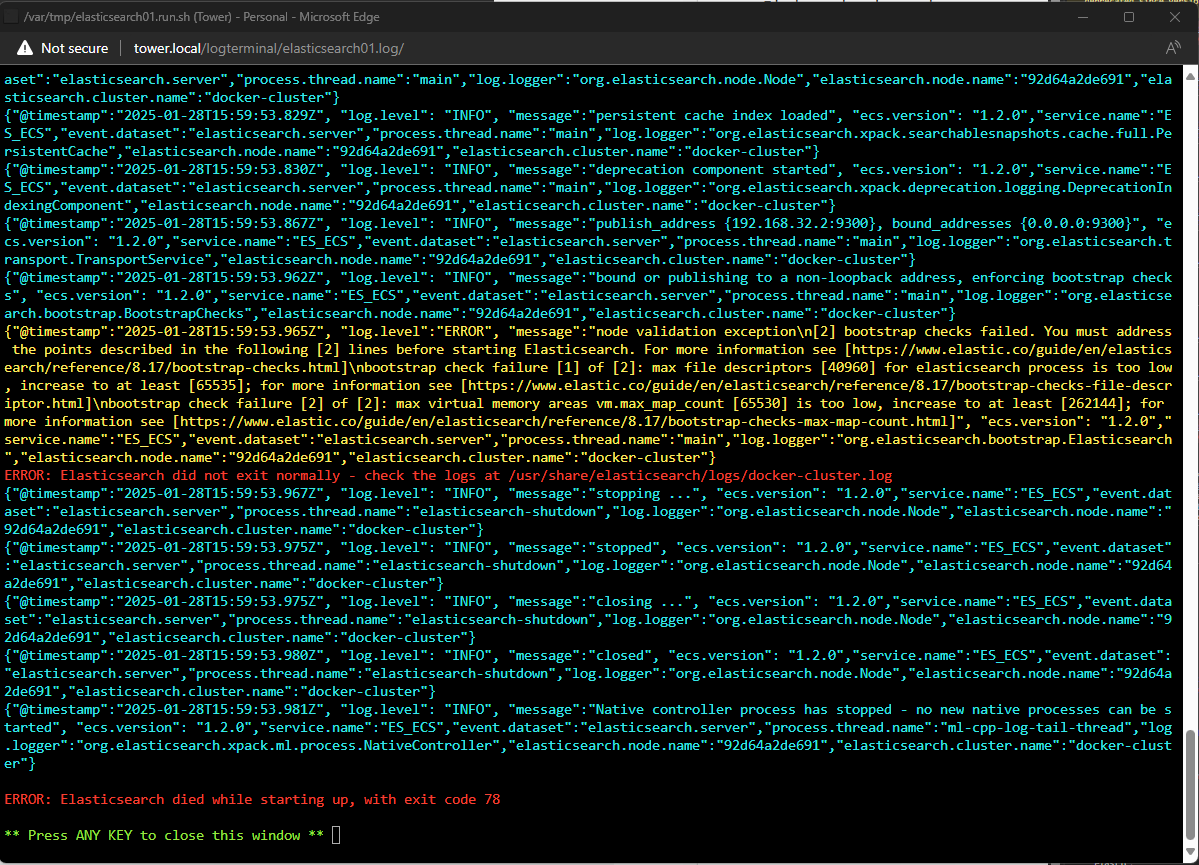
Mucho stupido. I don’t even want to start digging into Java errors (personal issue, I know). Buts lets continue.
Install via docker compose
Luckaly the documentation also refers to a docker compose section: https://www.elastic.co/guide/en/elasticsearch/reference/8.17/docker.html#docker-compose-file
Lets remove everything from my unraid environment and try this way.
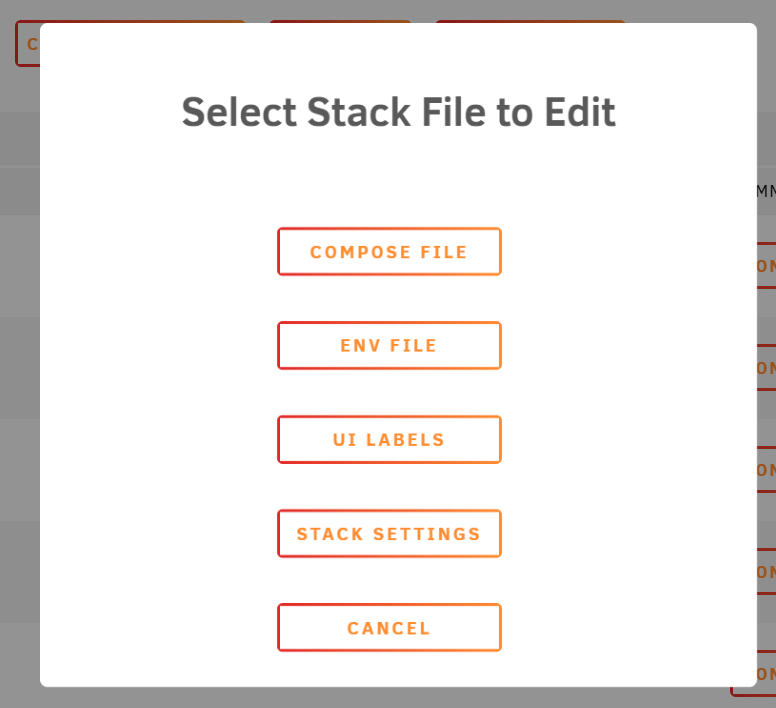
In unraid there is a section to setup the .env file and contents of the docker-compose. Lets copy and past some things from the documentation.
Hmmmm…. I dind’t even read what I copied, it appears to have 3 elastic search nodes. But okay, lets just take the configuration as supplied and see if it works.
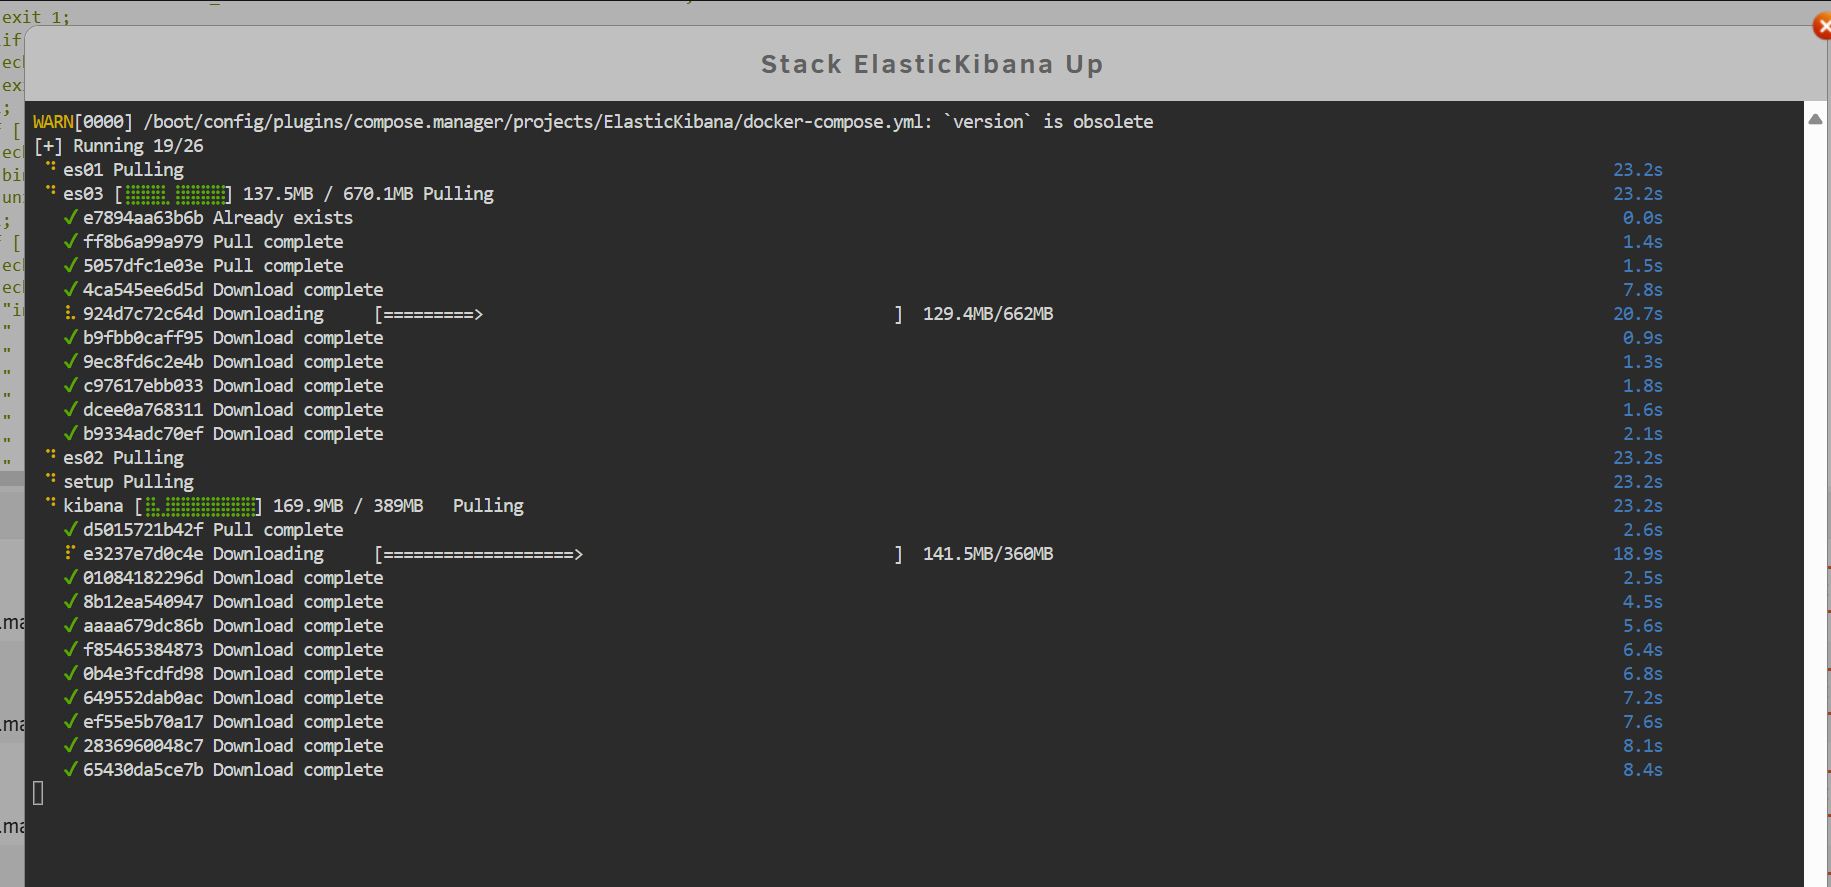
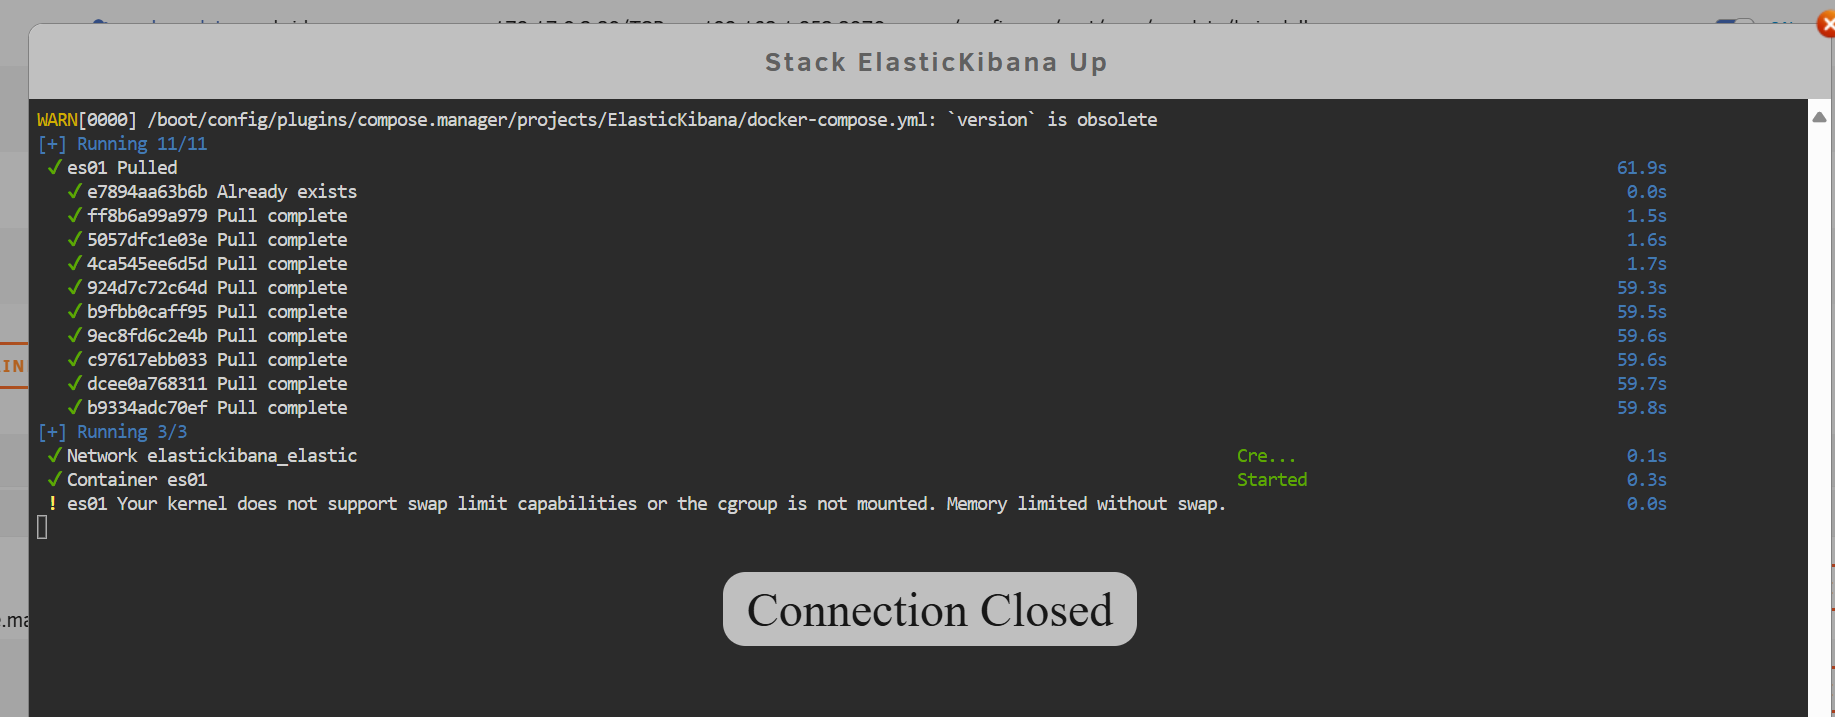
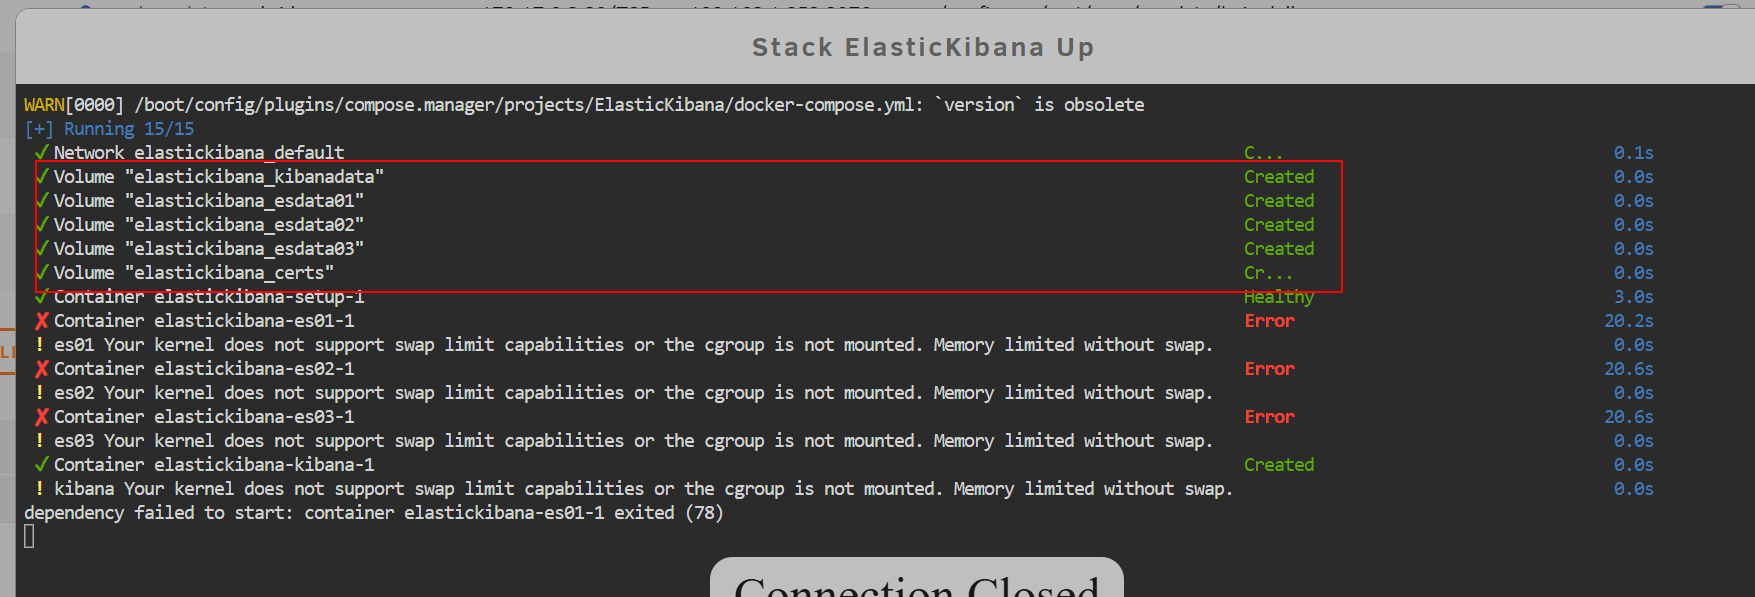
A few moments later, next error….
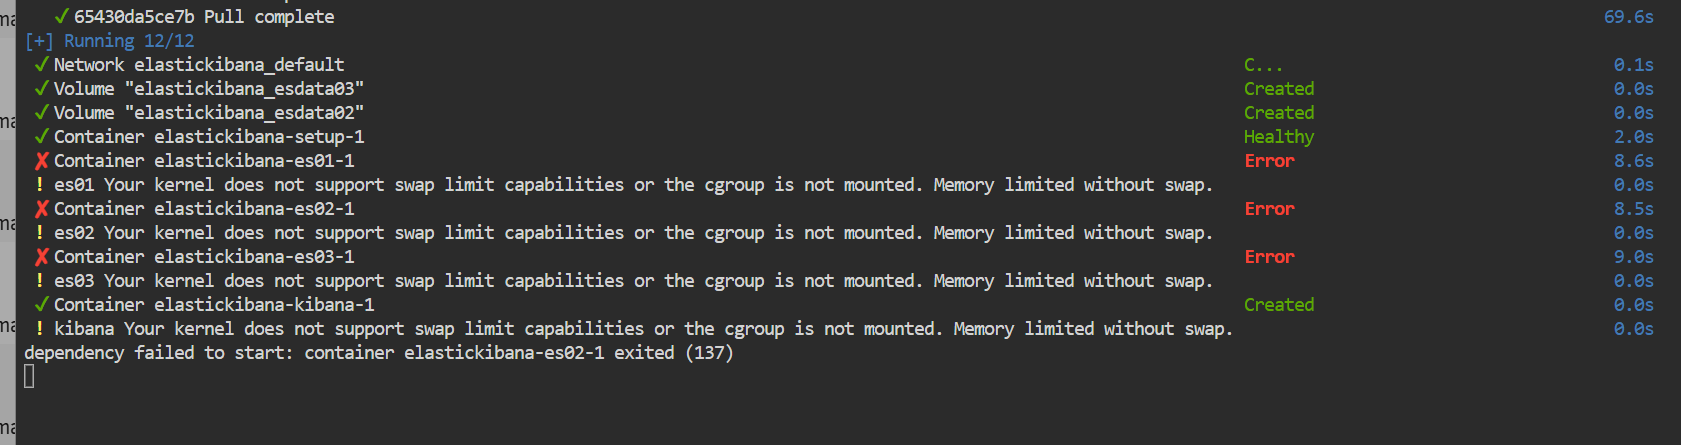
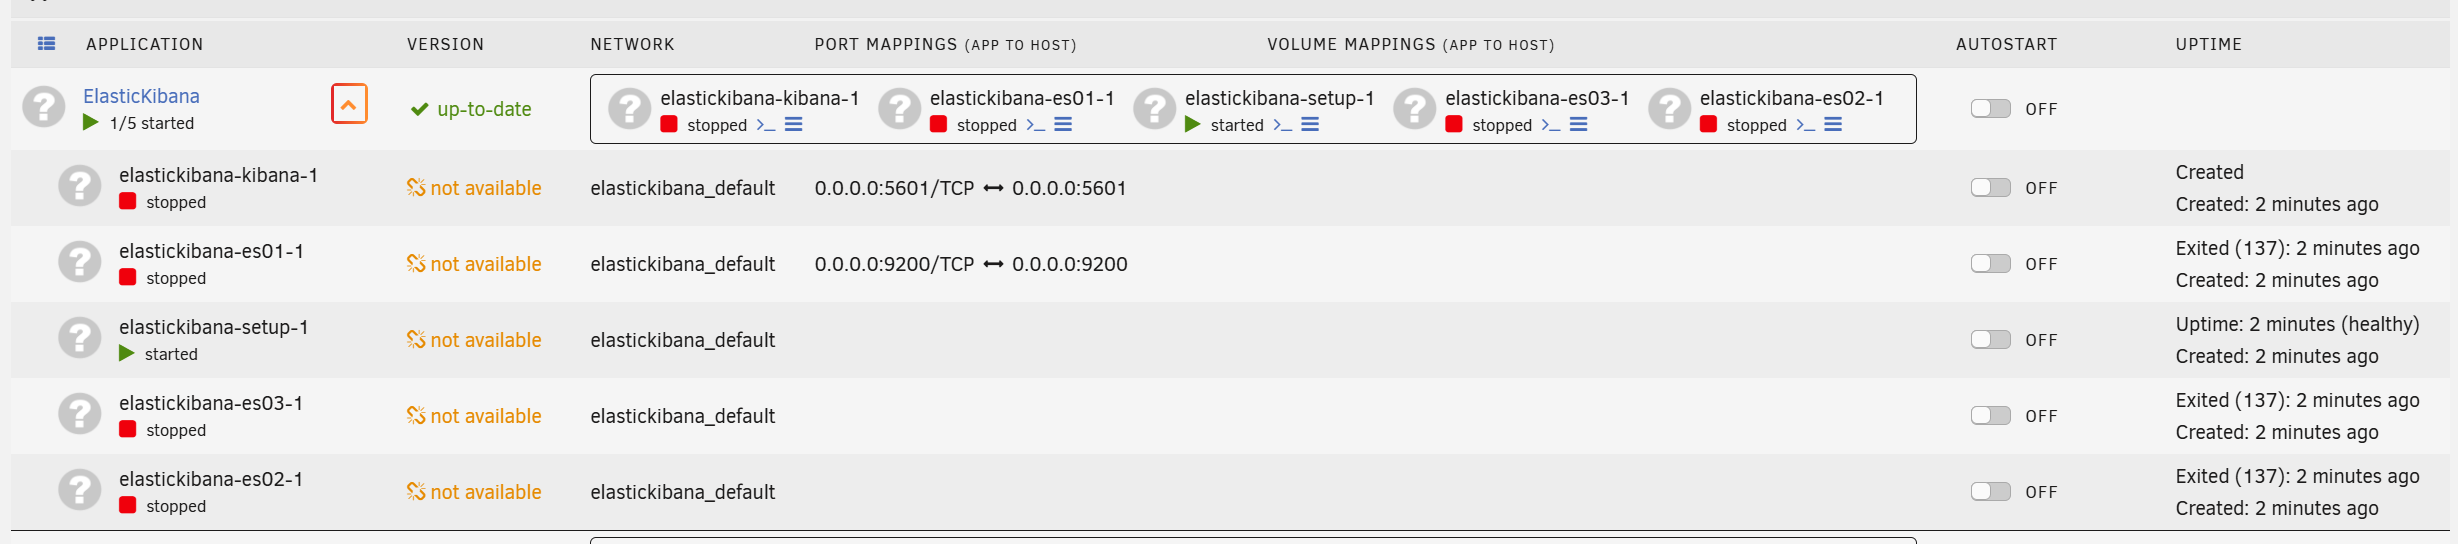
Still can’t easily startup my docker elastic search environment.
The unraid environment looks gives this information
Okay…. I’ll bite, lets google this error
Error solving
ERROR: Elasticsearch died while starting up, with exit code 137
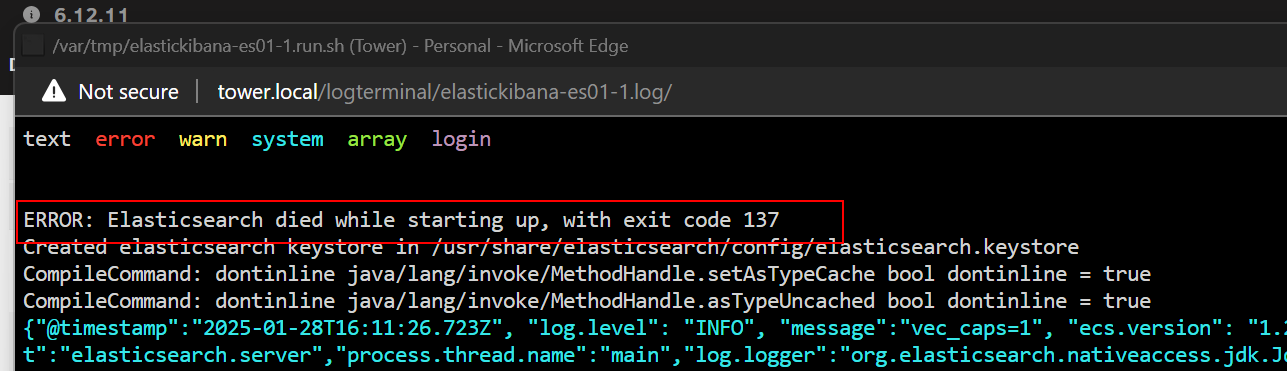
Something with memory or so.
Remove existing docker volumes
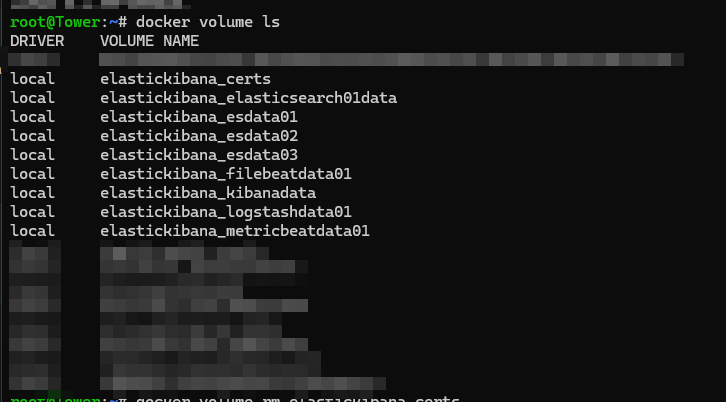
After deleting the volumes, a restart (docker compose up) didn’t help
ChatGPT again
So there are two errors, this is the prompt I’ve entered
I got this elastic search error
i run it on linux with docker compose
what to change

{"@timestamp":"2025-01-28T16:34:02.209Z", "log.level":"ERROR", "message":"node validation exception\n[2] bootstrap checks failed. You must address the points described in the following [2] lines before starting Elasticsearch. For more information see [https://www.elastic.co/guide/en/elasticsearch/reference/8.17/bootstrap-checks.html]\nbootstrap check failure [1] of [2]: max file descriptors [40960] for elasticsearch process is too low, increase to at least [65535]; for more information see [https://www.elastic.co/guide/en/elasticsearch/reference/8.17/bootstrap-checks-file-descriptor.html]\nbootstrap check failure [2] of [2]: max virtual memory areas vm.max_map_count [65530] is too low, increase to at least [262144]; for more information see [https://www.elastic.co/guide/en/elasticsearch/reference/8.17/bootstrap-checks-max-map-count.html]", "ecs.version": "1.2.0","service.name":"ES_ECS","event.dataset":"elasticsearch.server","process.thread.name":"main","log.logger":"org.elasticsearch.bootstrap.Elasticsearch","elasticsearch.node.name":"es01","elasticsearch.cluster.name":"docker-cluster"}
max file descriptors [40960] for elasticsearch process is too low, increase to at least [65535]
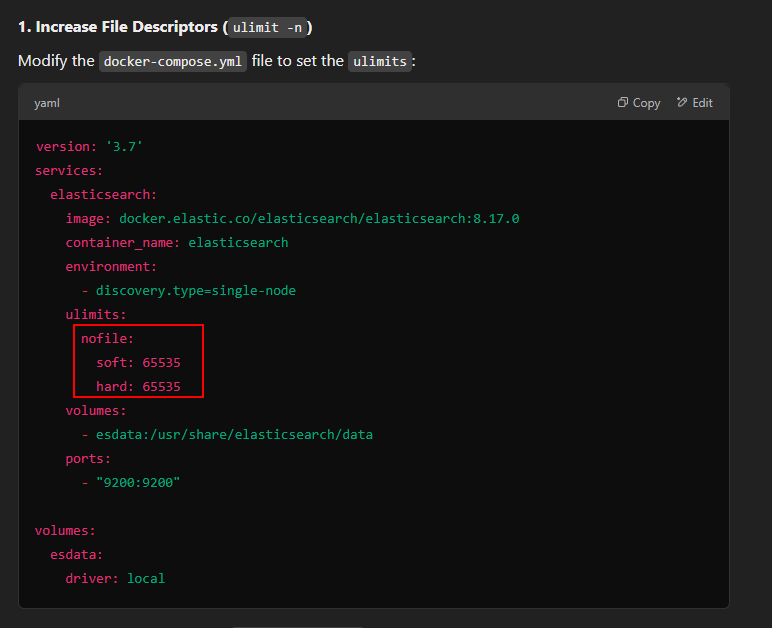
Quickly changing this for the es01, es02 and es03. And then, yeah, only one error left. So we are on the right track.
Solve error 2:
max virtual memory areas vm.max_map_count [65530] is too low, increase to at least [262144]
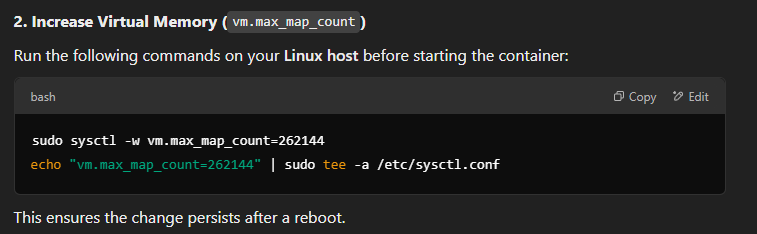
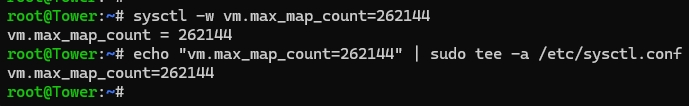
Now lets docker compose up this environment again
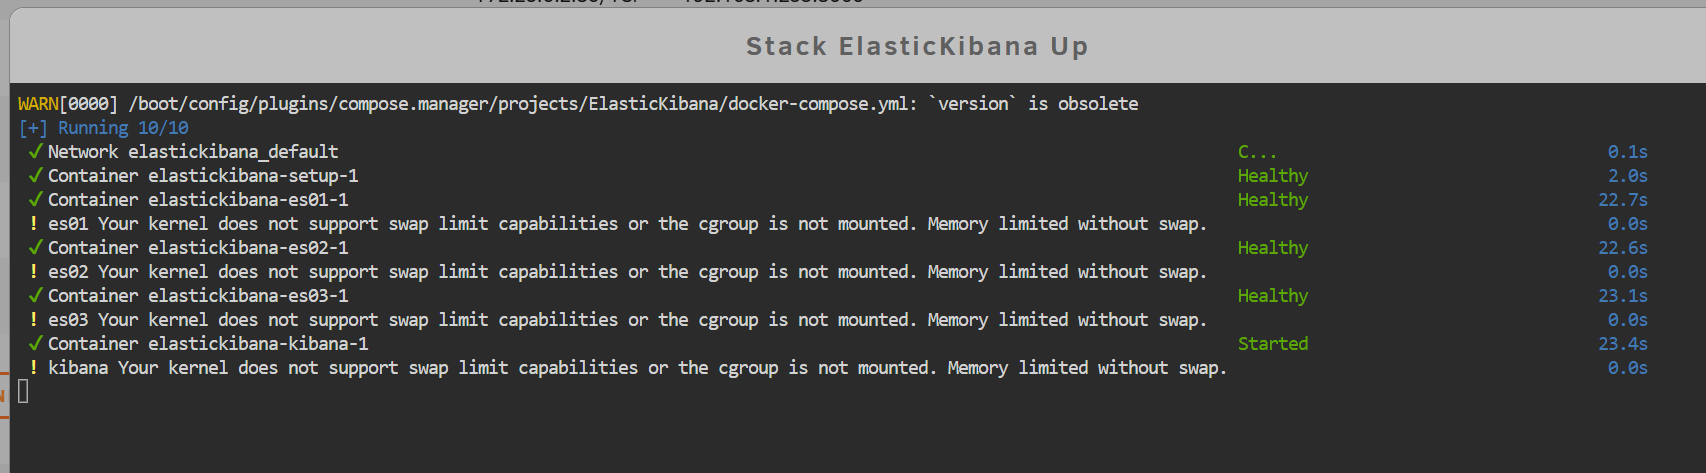
All green, but then what?
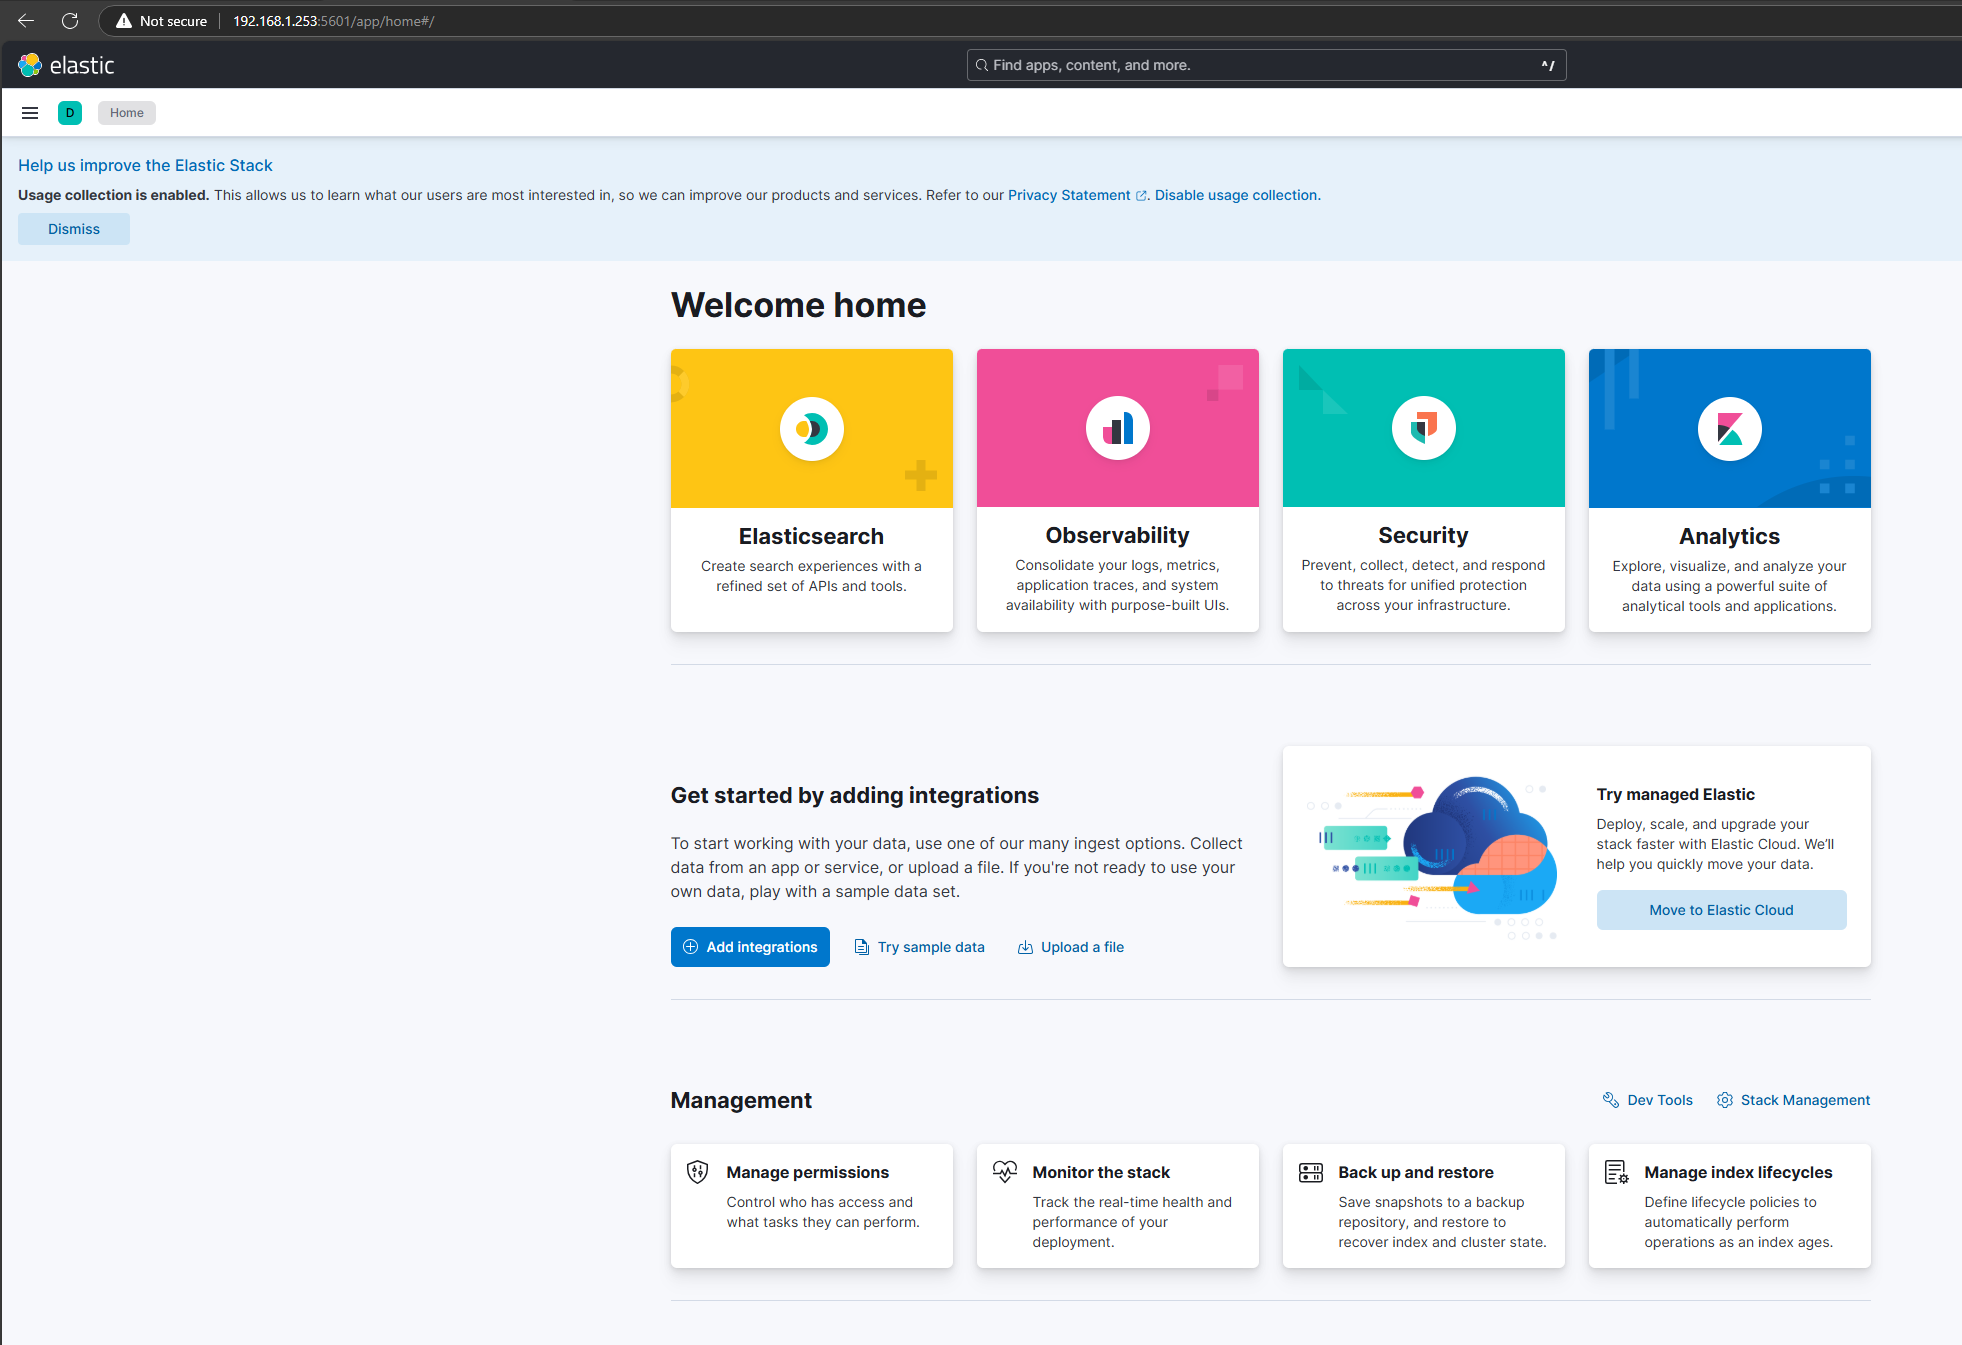
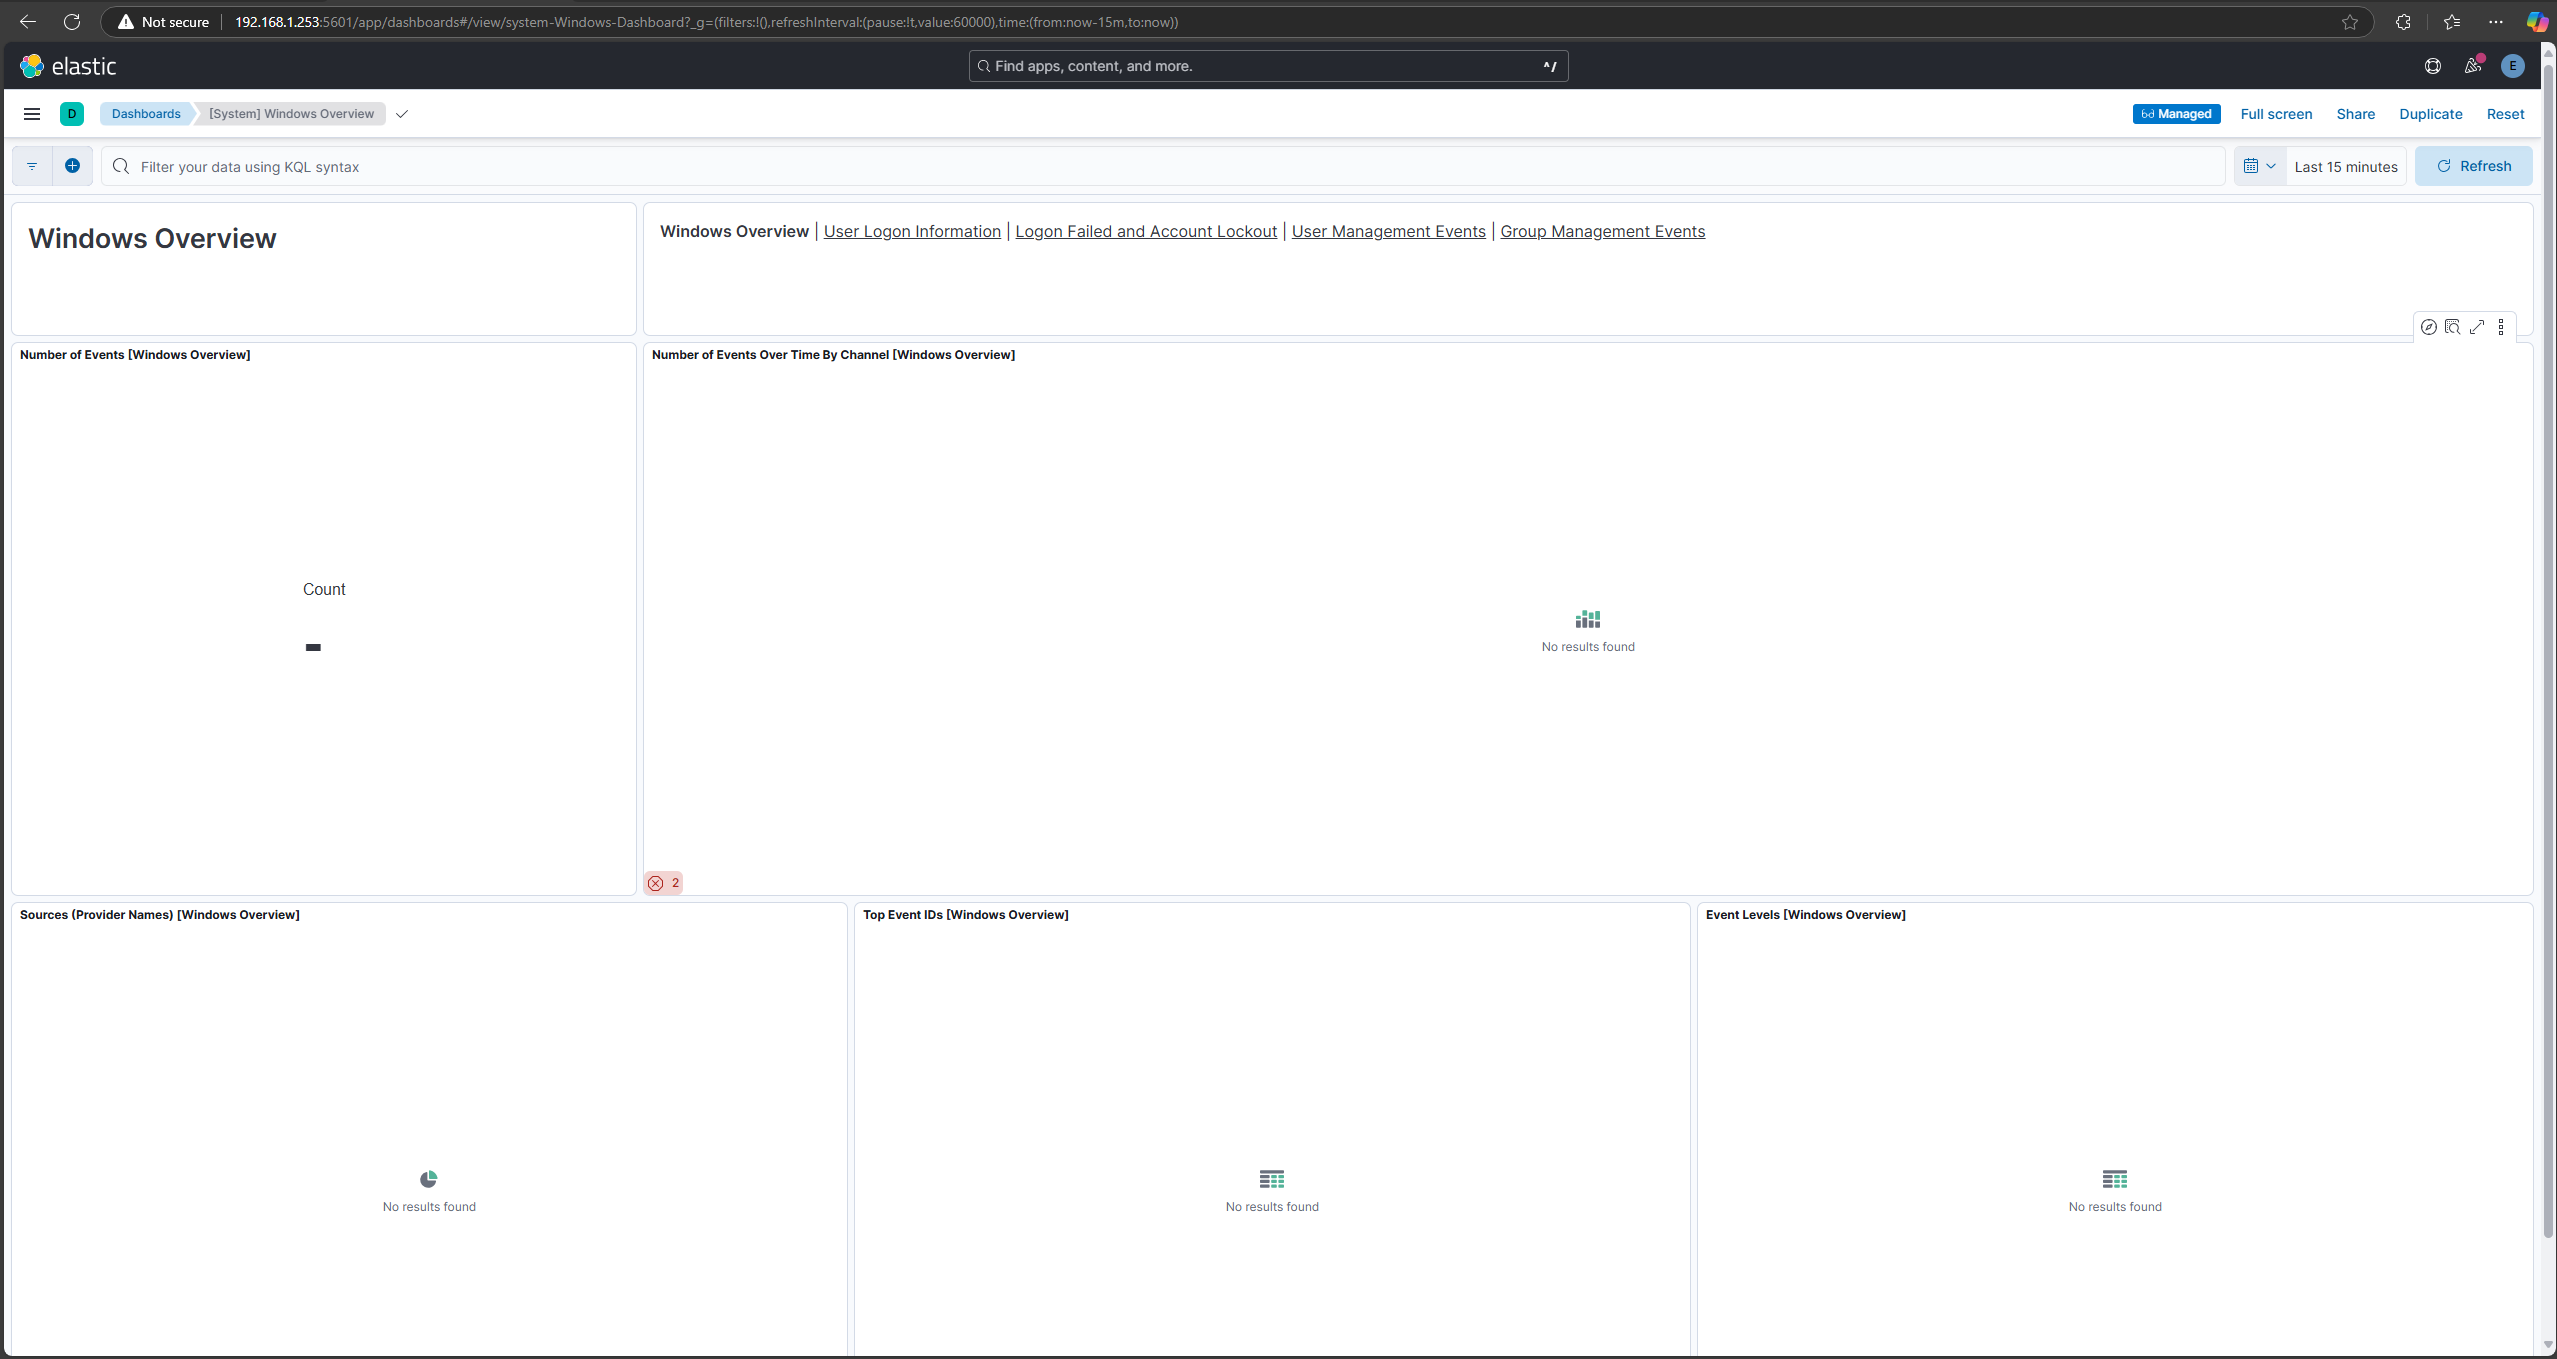
Well, the kibana webpage works
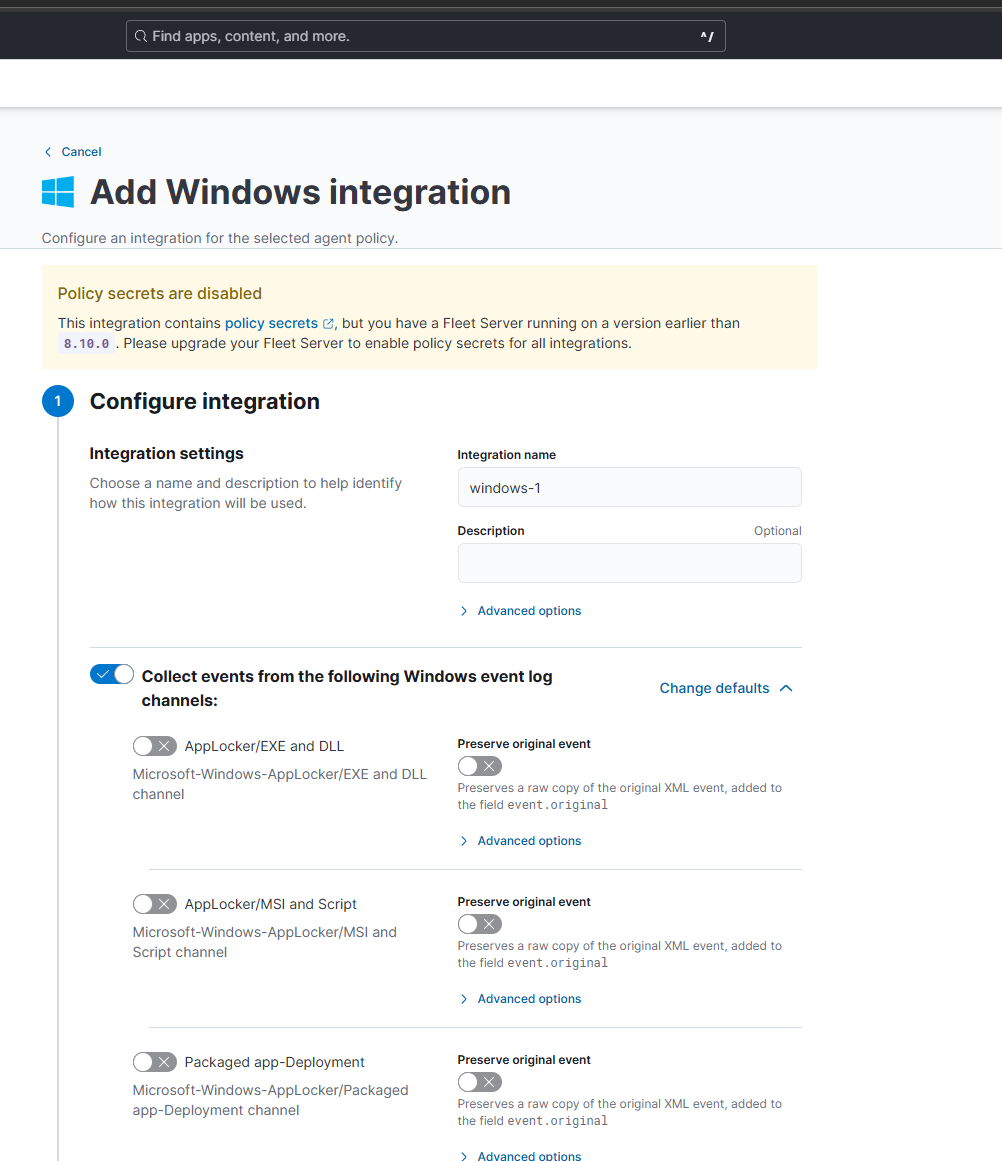
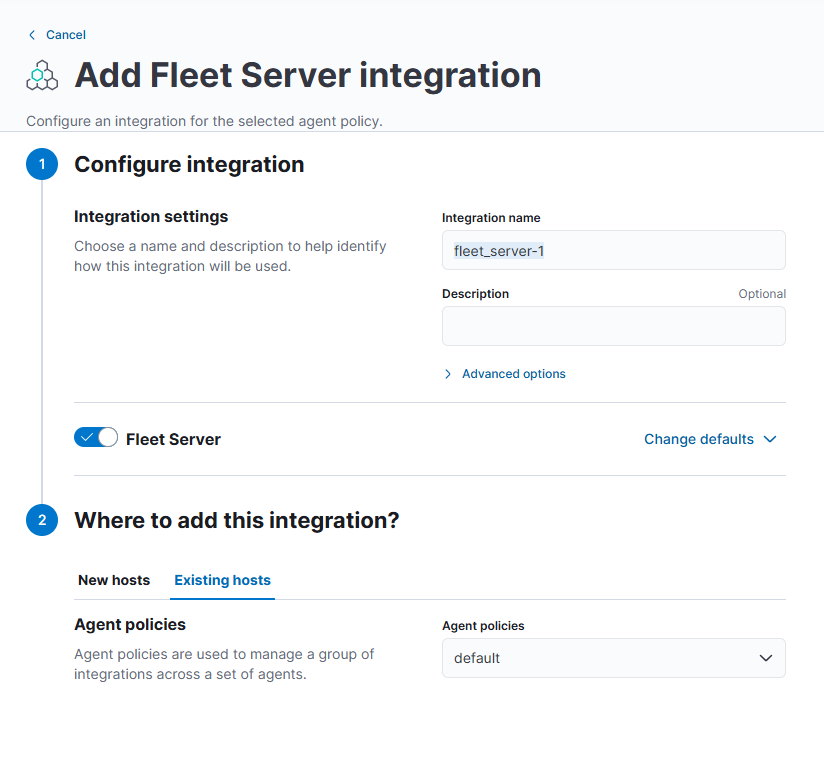
Add an intergration (Windows)
There is something with a Fleet Server, need to figure out what that is.
But the intergration I’m adding is via http://192.168.1.253:5601/app/fleet/integrations/windows-2.3.6/add-integration
Add an agent
This again gives me some troubles
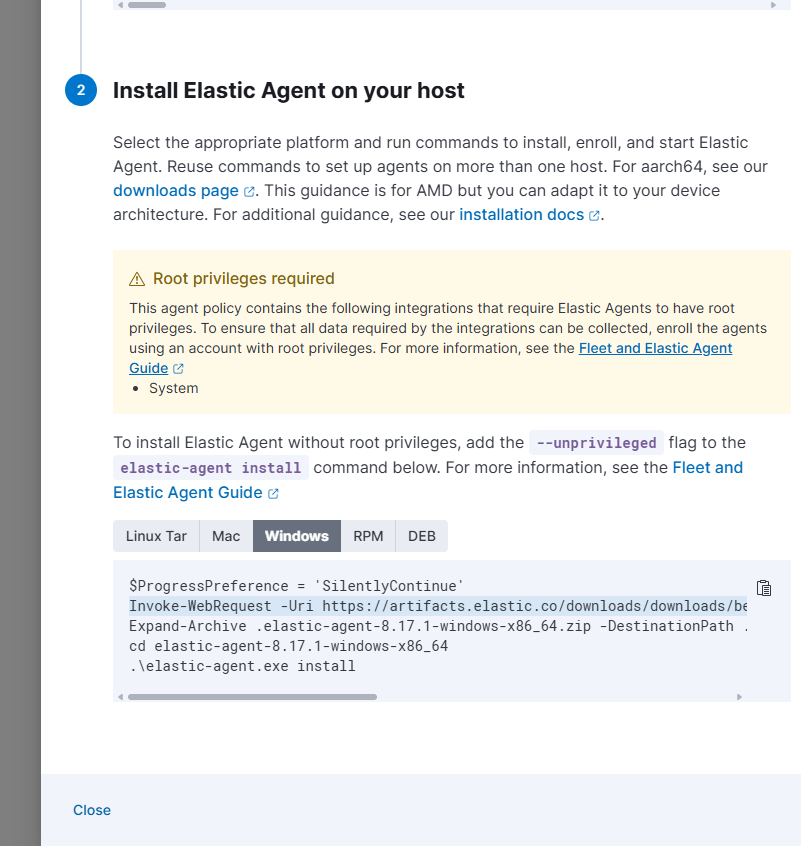
The url for the iwr command points to a 404 page….
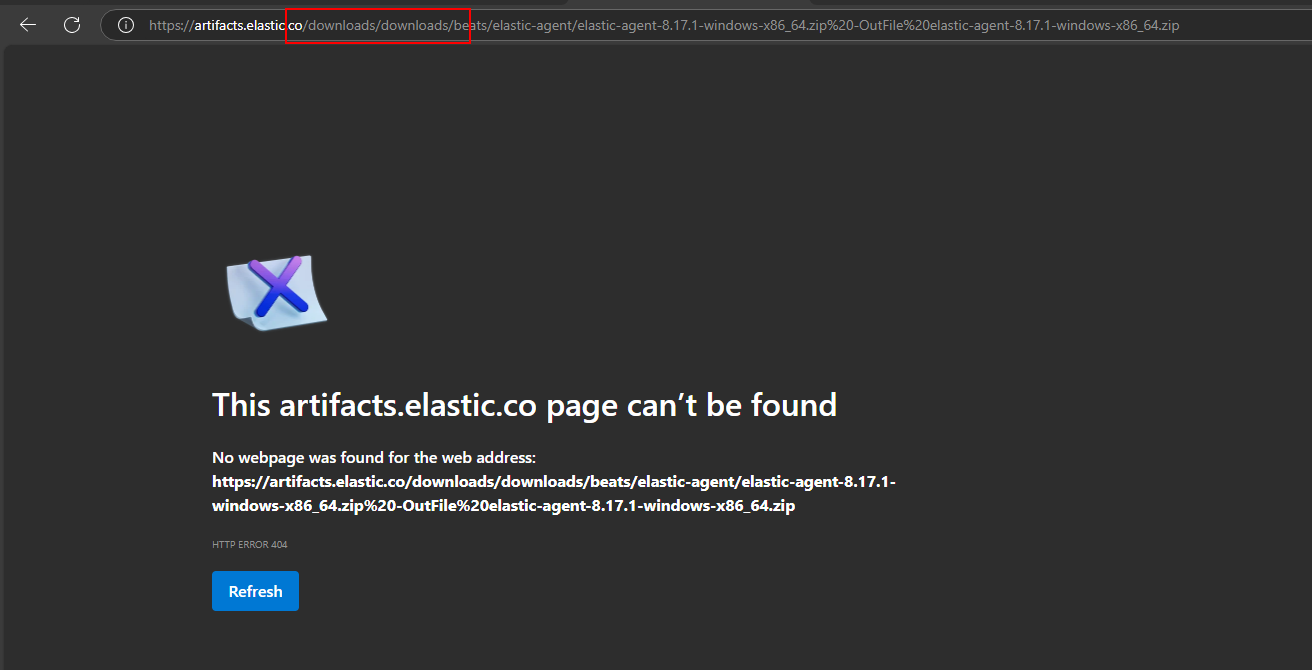
This was easily fixed by removing the double downloads directory.
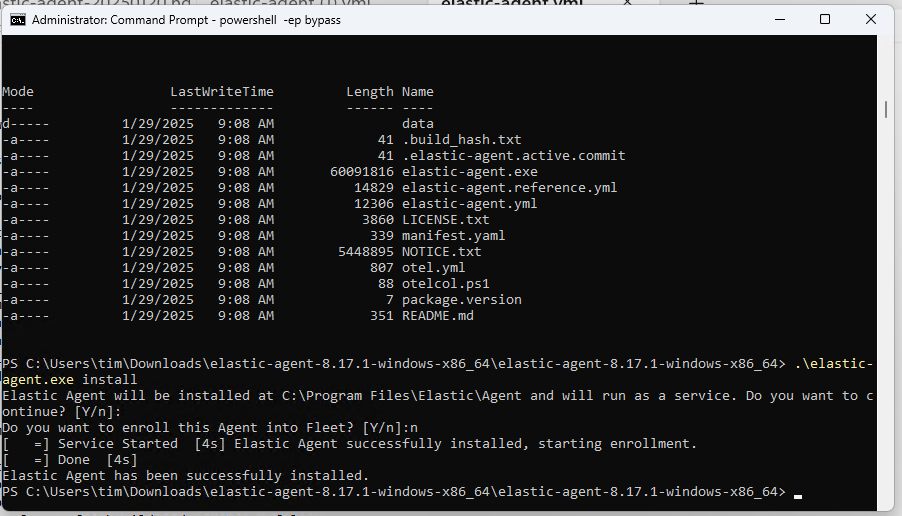
The installation was painless
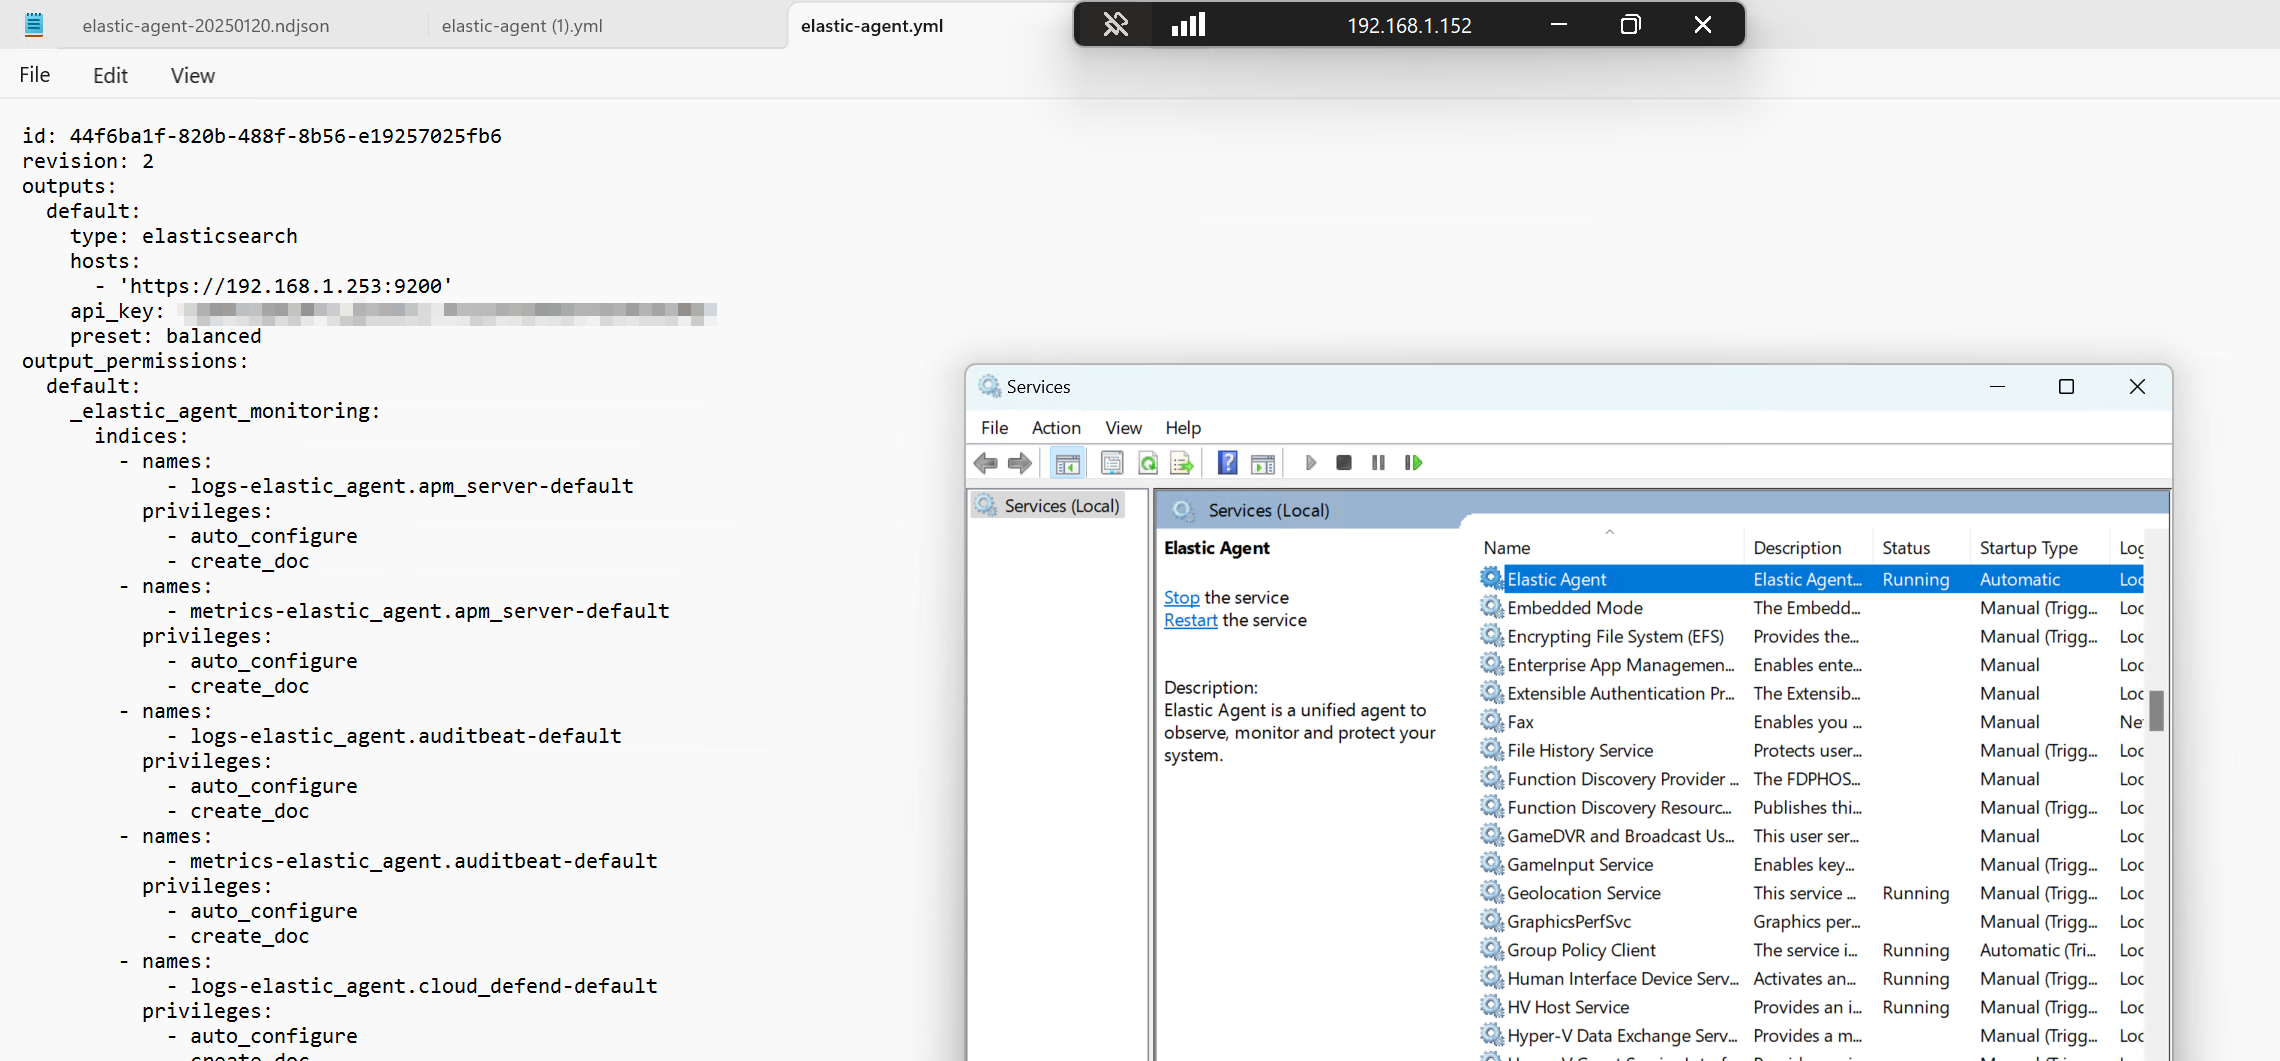
What about the configuration file
There is no mention what so ever about deploying the configuration file… I might have missed it
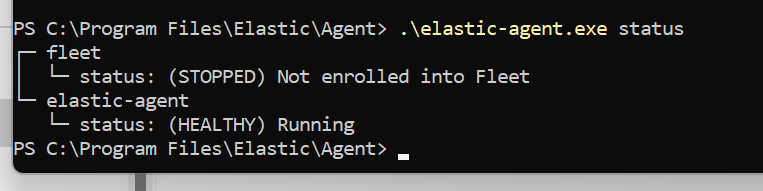
So what I did, downloaded the elastic-agent.yml file, and placed the contents over the file in C:\Program Files\Elastic\Agent, but if this was intended… Lets restart the service and see if it works
Where to find the data?
Pfff… the learning curve… How to see if my agent (another laptop) is sending data to ElasticSearch?
Okay, fleet server it is, as I got no idea what to do next
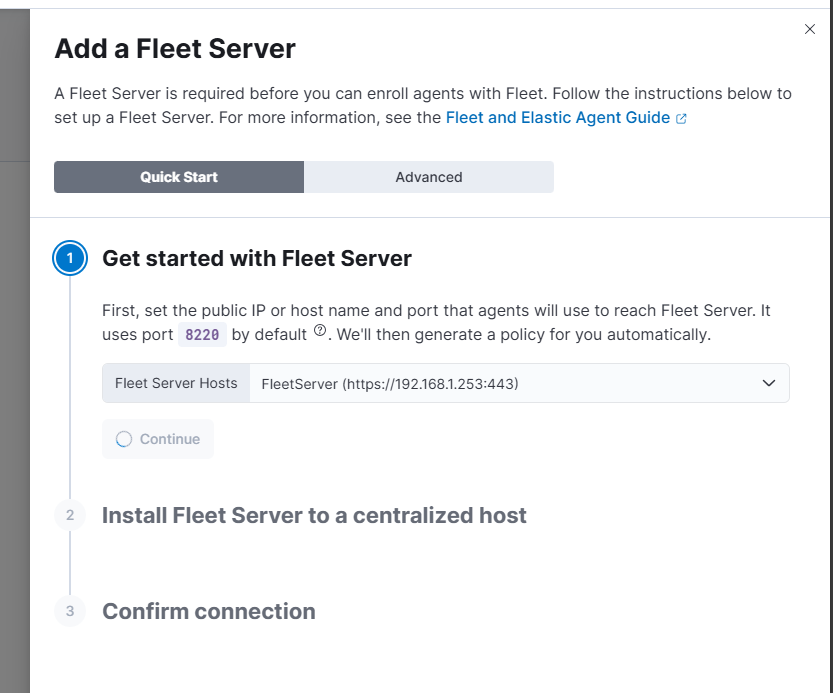
Pffff…. install it on some agent, okay, but I don’t have an agent
So lets search for a docker configuration setup that holds my fleet server
https://github.com/michaelhyatt/elastic-stack-fleet-docker-compose/blob/main/docker-compose.yml
After adding this part to my docker compose file, lets restart (down / up)
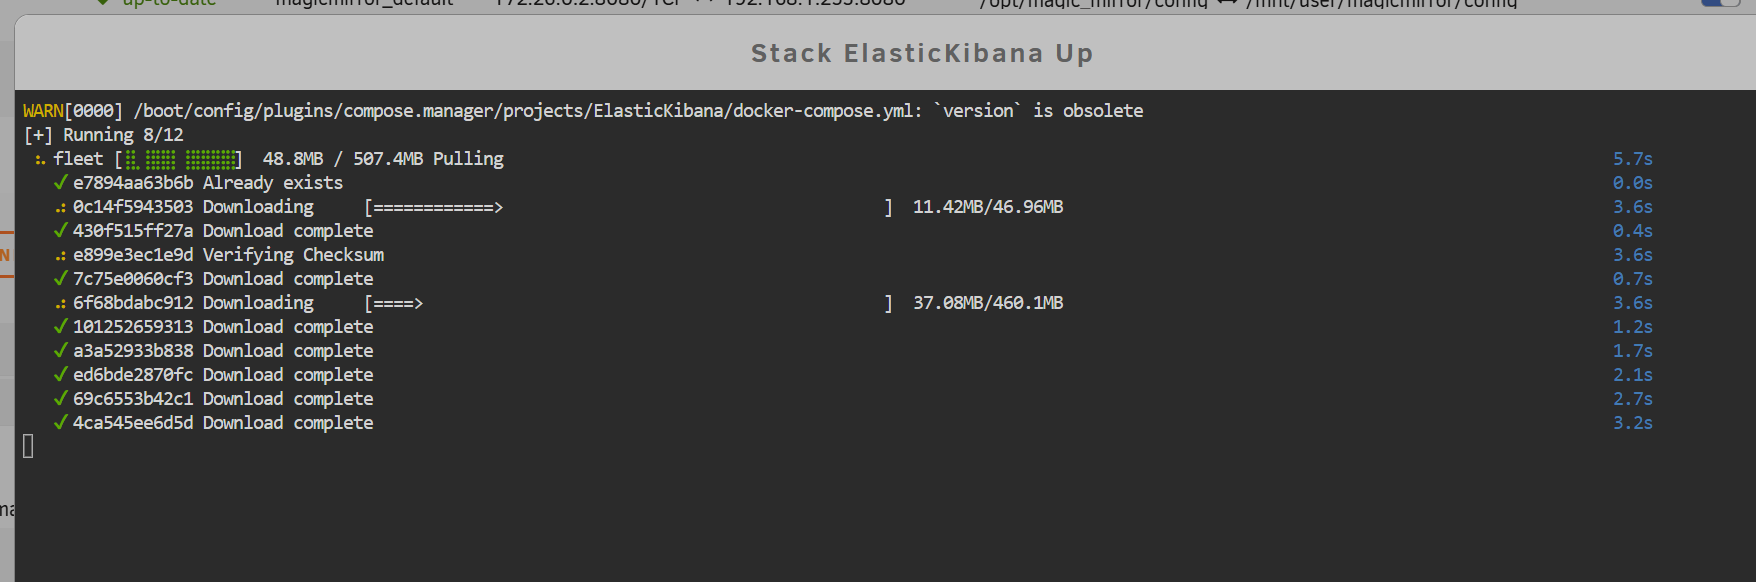
Well, that is new, its all green again haha
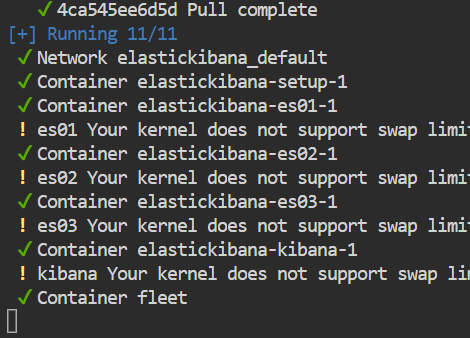
Okay, lets change the name, so remove the containername part from the docker compose file. This makes sure all containers share the same prefix

My unraid docker environment
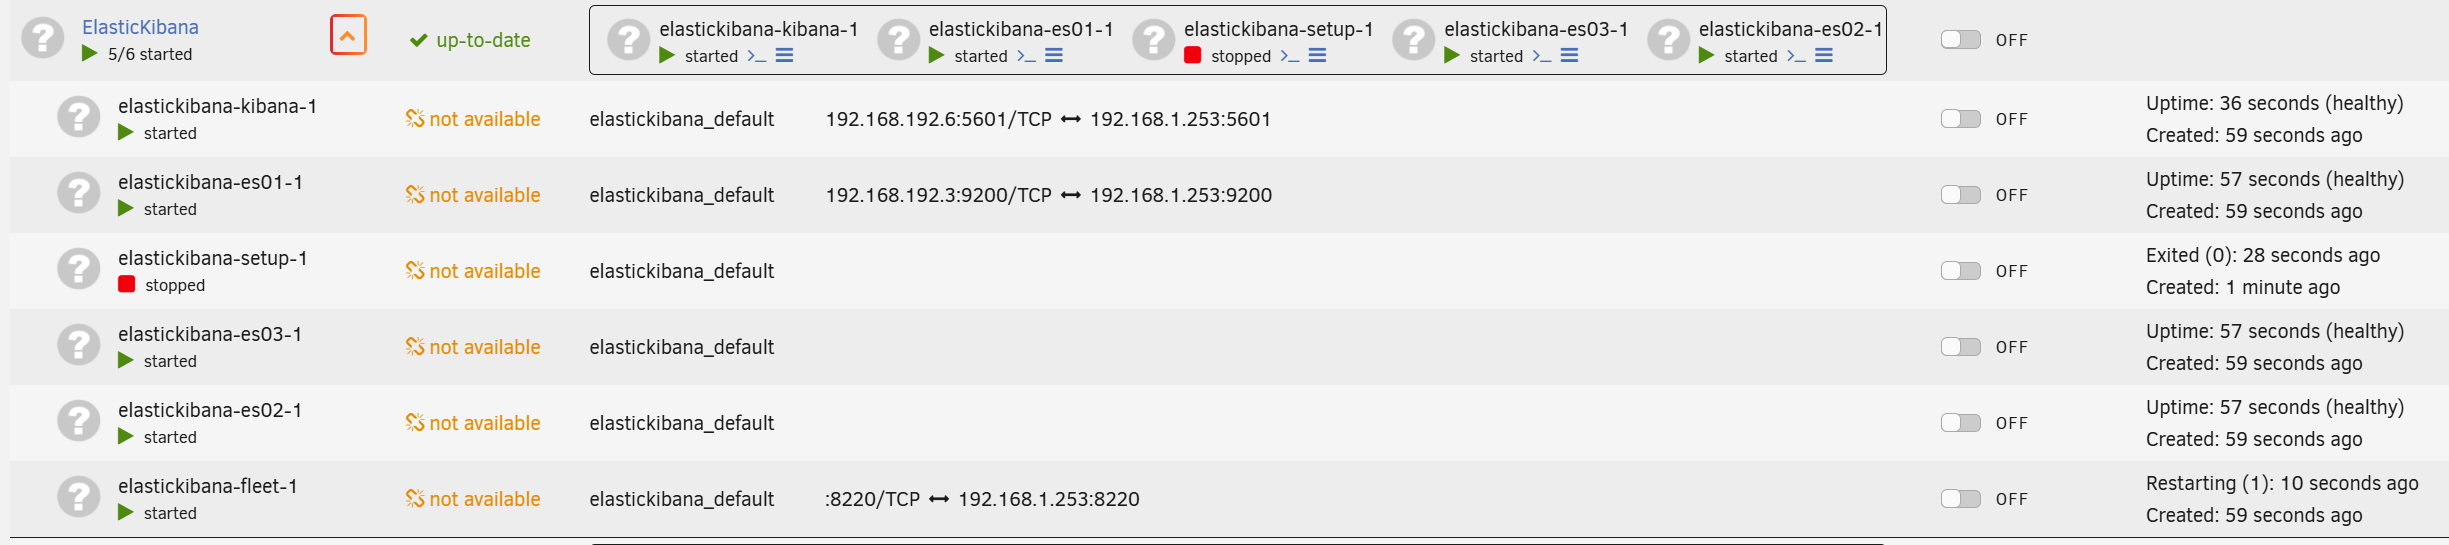
Troubleshoot the configuration (http and https)
Error: request to get security token from Kibana failed: fail to execute the HTTP POST request: Post "https://kibana:5601/api/fleet/service_tokens": http: server gave HTTP response to HTTPS client
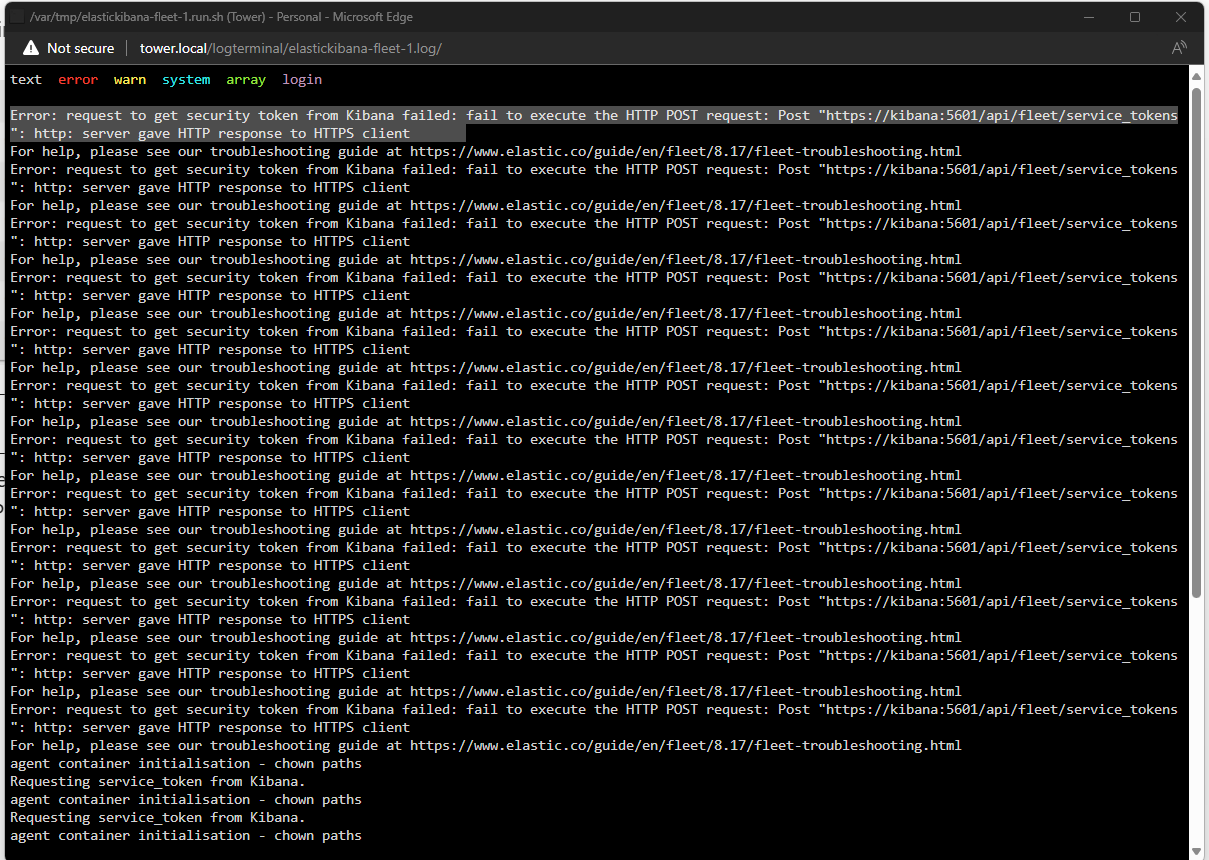
Change the docker compose file from https to http - KIBANA_FLEET_HOST=http://kibana:5601
Next error, no certificate…
"open /usr/share/elastic-agent/config/certs/fleet/fleet.crt: no such file or directory /usr/share/elastic-agent/config/certs/fleet/fleet.crt"
There is a section in the docker compose file that generates the certificates. Lets add the fleet part
          "  - name: fleet\n"\
          "    dns:\n"\
          "      - fleet\n"\
          "      - localhost\n"\
          "    ip:\n"\
          "      - 127.0.0.1\n"\
We need to remove the certs volume in order to recreate all certs docker volume rm elastickibana_certs
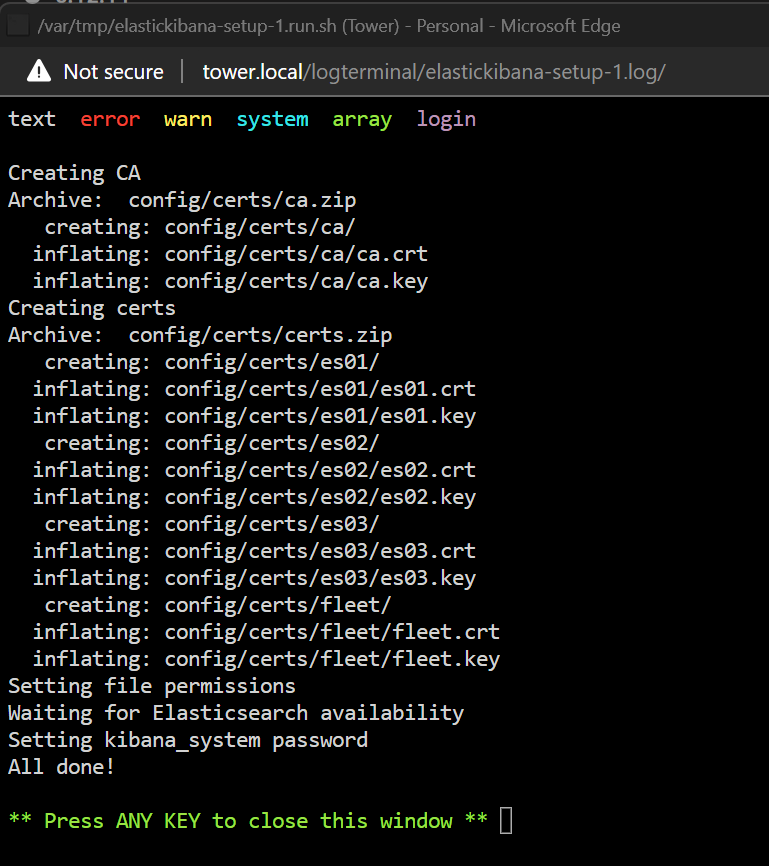
After down/up of docker compose, we see that the fleet cert is created
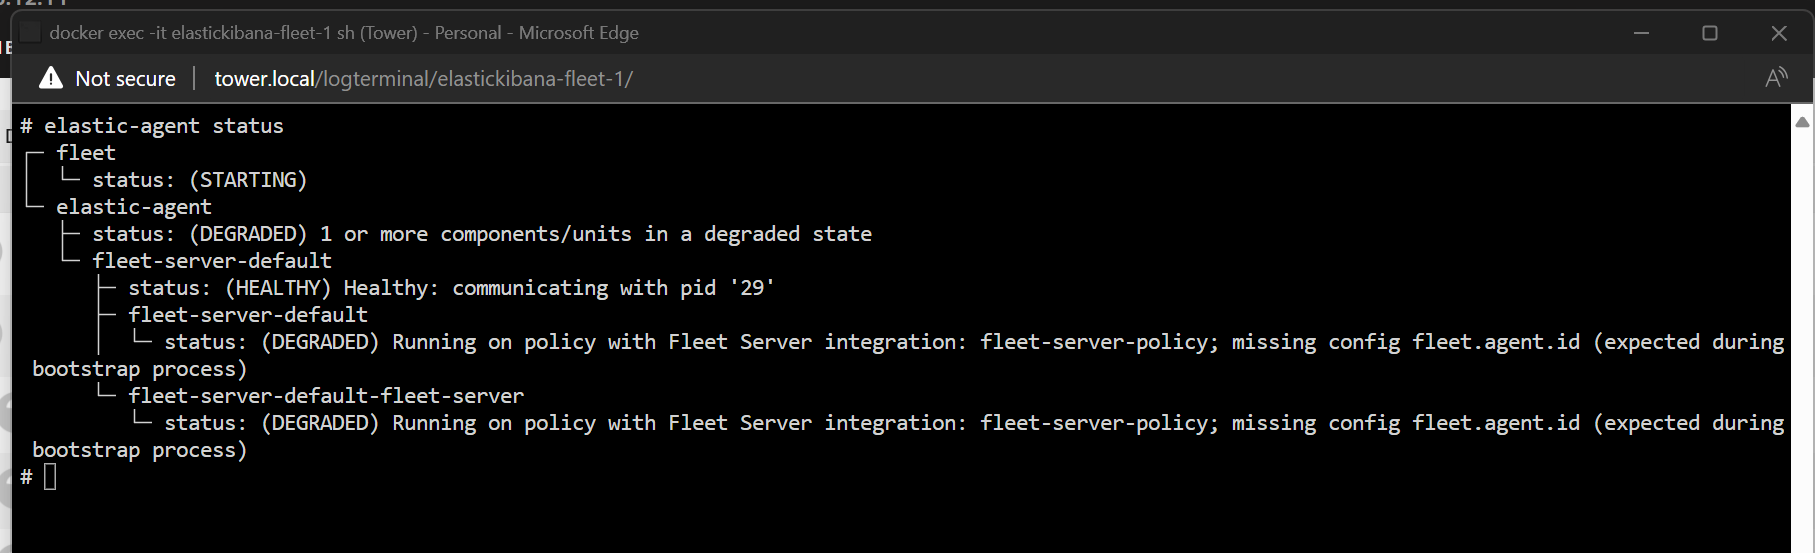
The Fleet server is now giving another error
Running on policy with Fleet Server integration: fleet-server-policy; missing config fleet.agent.id (expected during bootstrap process)
After almost an hour of configuration stuff, I’ve ended up with the following:
  fleet:
    depends_on:
      es01:
        condition: service_healthy
      kibana:
        condition: service_healthy
    image: docker.elastic.co/beats/elastic-agent:${STACK_VERSION}
    volumes:
      - certs:/usr/share/elastic-agent/config/certs
    ports:
      - ${FLEET_PORT}:8220
    restart: always
    user: root # note, synthetic browser monitors require this set to `elastic-agent`
    environment:
      - FLEET_SERVER_ENABLE=true
      - FLEET_SERVER_ELASTICSEARCH_HOST=https://es01:9200
      - FLEET_SERVER_ELASTICSEARCH_CA=/usr/share/elastic-agent/config/certs/ca/ca.crt
      - FLEET_SERVER_SERVICE_TOKEN=AA123XYZ
      - FLEET_URL=${FLEET_URL}
      - FLEET_CA=/usr/share/elastic-agent/config/certs/ca/ca.crt
      - FLEET_SERVER_CERT=/usr/share/elastic-agent/config/certs/fleet/fleet.crt
      - FLEET_SERVER_CERT_KEY=/usr/share/elastic-agent/config/certs/fleet/fleet.key
      - CERTIFICATE_AUTHORITIES=/usr/share/elastic-agent/config/certs/ca/ca.crt
    healthcheck:
      test:
        [
          "CMD-SHELL",
          "curl -s -I --cacert config/certs/ca/ca.crt https://fleet:8220 | grep -q 'HTTP/2 404'",
        ]
      interval: 10s
      timeout: 10s
      retries: 120
Now the error is Waiting on active enrollment keys to be created in default policy with Fleet Server integration
Some steps taken
Missing config fleet.agent.id (expected during bootstrap process)
The complete docker compose file
version: "2.2"

services:
  setup:
    image: docker.elastic.co/elasticsearch/elasticsearch:${STACK_VERSION}
    volumes:
      - certs:/usr/share/elasticsearch/config/certs
    user: "0"
    command: >
      bash -c '
        if [ x${ELASTIC_PASSWORD} == x ]; then
          echo "Set the ELASTIC_PASSWORD environment variable in the .env file";
          exit 1;
        elif [ x${KIBANA_PASSWORD} == x ]; then
          echo "Set the KIBANA_PASSWORD environment variable in the .env file";
          exit 1;
        fi;
        if [ ! -f config/certs/ca.zip ]; then
          echo "Creating CA";
          bin/elasticsearch-certutil ca --silent --pem -out config/certs/ca.zip;
          unzip config/certs/ca.zip -d config/certs;
        fi;
        if [ ! -f config/certs/certs.zip ]; then
          echo "Creating certs";
          echo -ne \
          "instances:\n"\
          "  - name: es01\n"\
          "    dns:\n"\
          "      - es01\n"\
          "      - localhost\n"\
          "    ip:\n"\
          "      - 127.0.0.1\n"\
          "  - name: es02\n"\
          "    dns:\n"\
          "      - es02\n"\
          "      - localhost\n"\
          "    ip:\n"\
          "      - 127.0.0.1\n"\
          "  - name: es03\n"\
          "    dns:\n"\
          "      - es03\n"\
          "      - localhost\n"\
          "    ip:\n"\
          "      - 127.0.0.1\n"\
          "  - name: fleet\n"\
          "    dns:\n"\
          "      - fleet\n"\
          "      - localhost\n"\
          "    ip:\n"\
          "      - 127.0.0.1\n"\
          > config/certs/instances.yml;
          bin/elasticsearch-certutil cert --silent --pem -out config/certs/certs.zip --in config/certs/instances.yml --ca-cert config/certs/ca/ca.crt --ca-key config/certs/ca/ca.key;
          unzip config/certs/certs.zip -d config/certs;
        fi;
        echo "Setting file permissions"
        chown -R root:root config/certs;
        find . -type d -exec chmod 750 \{\} \;;
        find . -type f -exec chmod 640 \{\} \;;
        echo "Waiting for Elasticsearch availability";
        until curl -s --cacert config/certs/ca/ca.crt https://es01:9200 | grep -q "missing authentication credentials"; do sleep 30; done;
        echo "Setting kibana_system password";
        until curl -s -X POST --cacert config/certs/ca/ca.crt -u "elastic:${ELASTIC_PASSWORD}" -H "Content-Type: application/json" https://es01:9200/_security/user/kibana_system/_password -d "{\"password\":\"${KIBANA_PASSWORD}\"}" | grep -q "^{}"; do sleep 10; done;
        echo "All done!";
      '
    healthcheck:
      test: ["CMD-SHELL", "[ -f config/certs/es01/es01.crt ]"]
      interval: 1s
      timeout: 5s
      retries: 120

  es01:
    depends_on:
      setup:
        condition: service_healthy
    image: docker.elastic.co/elasticsearch/elasticsearch:${STACK_VERSION}
    volumes:
      - certs:/usr/share/elasticsearch/config/certs
      - esdata01:/usr/share/elasticsearch/data
    ports:
      - ${ES_PORT}:9200
    environment:
      - node.name=es01
      - cluster.name=${CLUSTER_NAME}
      - cluster.initial_master_nodes=es01,es02,es03
      - discovery.seed_hosts=es02,es03
      - ELASTIC_PASSWORD=${ELASTIC_PASSWORD}
      - bootstrap.memory_lock=true
      - xpack.security.enabled=true
      - xpack.security.http.ssl.enabled=true
      - xpack.security.http.ssl.key=certs/es01/es01.key
      - xpack.security.http.ssl.certificate=certs/es01/es01.crt
      - xpack.security.http.ssl.certificate_authorities=certs/ca/ca.crt
      - xpack.security.transport.ssl.enabled=true
      - xpack.security.transport.ssl.key=certs/es01/es01.key
      - xpack.security.transport.ssl.certificate=certs/es01/es01.crt
      - xpack.security.transport.ssl.certificate_authorities=certs/ca/ca.crt
      - xpack.security.transport.ssl.verification_mode=certificate
      - xpack.license.self_generated.type=${LICENSE}
      - xpack.ml.use_auto_machine_memory_percent=true
    mem_limit: ${MEM_LIMIT}
    ulimits:
      memlock:
        soft: -1
        hard: -1
      nofile:
        soft: 65535
        hard: 65535
    healthcheck:
      test:
        [
          "CMD-SHELL",
          "curl -s --cacert config/certs/ca/ca.crt https://localhost:9200 | grep -q 'missing authentication credentials'",
        ]
      interval: 10s
      timeout: 10s
      retries: 120

  es02:
    depends_on:
      - es01
    image: docker.elastic.co/elasticsearch/elasticsearch:${STACK_VERSION}
    volumes:
      - certs:/usr/share/elasticsearch/config/certs
      - esdata02:/usr/share/elasticsearch/data
    environment:
      - node.name=es02
      - cluster.name=${CLUSTER_NAME}
      - cluster.initial_master_nodes=es01,es02,es03
      - discovery.seed_hosts=es01,es03
      - ELASTIC_PASSWORD=${ELASTIC_PASSWORD}
      - bootstrap.memory_lock=true
      - xpack.security.enabled=true
      - xpack.security.http.ssl.enabled=true
      - xpack.security.http.ssl.key=certs/es02/es02.key
      - xpack.security.http.ssl.certificate=certs/es02/es02.crt
      - xpack.security.http.ssl.certificate_authorities=certs/ca/ca.crt
      - xpack.security.transport.ssl.enabled=true
      - xpack.security.transport.ssl.key=certs/es02/es02.key
      - xpack.security.transport.ssl.certificate=certs/es02/es02.crt
      - xpack.security.transport.ssl.certificate_authorities=certs/ca/ca.crt
      - xpack.security.transport.ssl.verification_mode=certificate
      - xpack.license.self_generated.type=${LICENSE}
      - xpack.ml.use_auto_machine_memory_percent=true
    mem_limit: ${MEM_LIMIT}
    ulimits:
      memlock:
        soft: -1
        hard: -1
      nofile:
        soft: 65535
        hard: 65535
    healthcheck:
      test:
        [
          "CMD-SHELL",
          "curl -s --cacert config/certs/ca/ca.crt https://localhost:9200 | grep -q 'missing authentication credentials'",
        ]
      interval: 10s
      timeout: 10s
      retries: 120

  es03:
    depends_on:
      - es02
    image: docker.elastic.co/elasticsearch/elasticsearch:${STACK_VERSION}
    volumes:
      - certs:/usr/share/elasticsearch/config/certs
      - esdata03:/usr/share/elasticsearch/data
    environment:
      - node.name=es03
      - cluster.name=${CLUSTER_NAME}
      - cluster.initial_master_nodes=es01,es02,es03
      - discovery.seed_hosts=es01,es02
      - ELASTIC_PASSWORD=${ELASTIC_PASSWORD}
      - bootstrap.memory_lock=true
      - xpack.security.enabled=true
      - xpack.security.http.ssl.enabled=true
      - xpack.security.http.ssl.key=certs/es03/es03.key
      - xpack.security.http.ssl.certificate=certs/es03/es03.crt
      - xpack.security.http.ssl.certificate_authorities=certs/ca/ca.crt
      - xpack.security.transport.ssl.enabled=true
      - xpack.security.transport.ssl.key=certs/es03/es03.key
      - xpack.security.transport.ssl.certificate=certs/es03/es03.crt
      - xpack.security.transport.ssl.certificate_authorities=certs/ca/ca.crt
      - xpack.security.transport.ssl.verification_mode=certificate
      - xpack.license.self_generated.type=${LICENSE}
      - xpack.ml.use_auto_machine_memory_percent=true
    mem_limit: ${MEM_LIMIT}
    ulimits:
      memlock:
        soft: -1
        hard: -1
      nofile:
        soft: 65535
        hard: 65535
    healthcheck:
      test:
        [
          "CMD-SHELL",
          "curl -s --cacert config/certs/ca/ca.crt https://localhost:9200 | grep -q 'missing authentication credentials'",
        ]
      interval: 10s
      timeout: 10s
      retries: 120

  kibana:
    depends_on:
      es01:
        condition: service_healthy
      es02:
        condition: service_healthy
      es03:
        condition: service_healthy
    image: docker.elastic.co/kibana/kibana:${STACK_VERSION}
    volumes:
      - certs:/usr/share/kibana/config/certs
      - kibanadata:/usr/share/kibana/data
    ports:
      - ${KIBANA_PORT}:5601
    environment:
      - SERVERNAME=kibana
      - ELASTICSEARCH_HOSTS=https://es01:9200
      - ELASTICSEARCH_USERNAME=kibana_system
      - ELASTICSEARCH_PASSWORD=${KIBANA_PASSWORD}
      - ELASTICSEARCH_SSL_CERTIFICATEAUTHORITIES=config/certs/ca/ca.crt
    mem_limit: ${MEM_LIMIT}
    healthcheck:
      test:
        [
          "CMD-SHELL",
          "curl -s -I http://localhost:5601 | grep -q 'HTTP/1.1 302 Found'",
        ]
      interval: 10s
      timeout: 10s
      retries: 120

  fleet:
    depends_on:
      es01:
        condition: service_healthy
      kibana:
        condition: service_healthy
    image: docker.elastic.co/beats/elastic-agent:${STACK_VERSION}
    volumes:
      - certs:/usr/share/elastic-agent/config/certs
    ports:
      - ${FLEET_PORT}:8220
    restart: always
    user: root # note, synthetic browser monitors require this set to `elastic-agent`
    environment:
      - FLEET_SERVER_ENABLE=true
      - FLEET_SERVER_ELASTICSEARCH_HOST=https://es01:9200
      - FLEET_SERVER_ELASTICSEARCH_CA=/usr/share/elastic-agent/config/certs/ca/ca.crt
      - FLEET_SERVER_SERVICE_TOKEN=AA123XYZ
      - FLEET_URL=${FLEET_URL}
      - FLEET_CA=/usr/share/elastic-agent/config/certs/ca/ca.crt
      - FLEET_SERVER_CERT=/usr/share/elastic-agent/config/certs/fleet/fleet.crt
      - FLEET_SERVER_CERT_KEY=/usr/share/elastic-agent/config/certs/fleet/fleet.key
      - CERTIFICATE_AUTHORITIES=/usr/share/elastic-agent/config/certs/ca/ca.crt

      - FLEET_SERVER_POLICY_ID=fleet-server-policy
    healthcheck:
      test:
        [
          "CMD-SHELL",
          "curl -s -I --cacert config/certs/ca/ca.crt https://fleet:8220 | grep -q 'HTTP/2 404'",
        ]
      interval: 10s
      timeout: 10s
      retries: 120

volumes:
  certs:
    driver: local
  esdata01:
    driver: local
  esdata02:
    driver: local
  esdata03:
    driver: local
  kibanadata:
    driver: local
Lets quit for today…